ADA-p4-data-story
Repository for the datastory part of milestone P4 for CS-401 ADA (EPFL)
Project maintained by richieYT-wan Hosted on GitHub Pages — Theme by mattgraham
Signed Networks in Social Media
Structure in social media, birds of a feather…
Most of the current popular social networks only showcase positive links. Think of Facebook, Instagram, Twitter, where one can like, befriend, follow, etc., but never actually “dislike”. In real life, though, relationships can be a little more complex. People can dislike each other, leading to some form of distance, not only on a personal level but also on a group level.
The balance between positive and negative links may both play a role in the overall structure of a network. More specifically, negative relationships may split the overall network. Think of a practical example: a group of 10 persons, say group A, may share something in common, such as hobbies, interests, way of thinking, etc. They become friends, and thus have positive edges between them. On the other hand, another group of friends, say group B think differently, and highly dislike group A, and thus have negative edges towards group A. This effectively separates the network into two, as you are less likely to be friend with someone of the other group if your group dislike their group overall. For the sake of the argument, although Twitter, Facebook, etc. does not allow to create negative links, groups with different views are still likely to be separated, for example due to political views, reflecting both their background (social class, demographic, etc.) and real life social network (circle of friends).
Dataset
Some social medias, though, allow the formation of negative links. In our case, we have three datasets coming from Stanford, collected 2010. These are three social networks where negative edge take different forms:
-
The first one is from Epinions , where users can create consumer review of products. The basis of links are as follows : any given user can
trust, ordistrustanother, thus creating apositiveornegative edge. The trust relationships form theWeb of Trustwhich, combined with the actual ratings tailor the reviews shown to any given user based on his circle. Interestingly, Epinions is now dead. Here’s an interesting read. -
The second one is from Slashdot, a technology-related news website. The particularity is that the news are user-submitted and editor-evaluated. On top of that, users can tag each other as
friendorfoe, which serve as the basis for ourpositiveandnegative edges. -
The last one is from Wikipedia, more specifically Wikipedia election data. Some Wikipedia users can be elected to become administrator, granting them additional rights and access. A user can be nominated for election through a Request for Adminship (RfA), and a public voting ensues. The sign of the edge directly relates to the vote casted on a given election. Given the nature of this dataset, there are many one-way edges, in the sense that since one must be nominated for election to receive votes, many edges are not reciprocated.
All datasets are roughly in the same format, i.e. an edgelist with columns "FromNodeId", "ToNodeId", "Sign" which represents all the connections in their respective network.
Sociology : putting the social in social networks

source:https://cis.cornell.edu/internet-trolls-are-made-not-born-cis-researchers-say
Now of course, anybody can vote the way they can. There have been countless accounts of trolls on the internet, and you should be careful to not feed them. Nonetheless, social theories still apply and we may expect trolls to be outliers rather than the norm. In the context of our dataset, trolls may simply refer to people who give negative votes, or links, to everybody, with no apparent reason other. Despite that, some social theories still apply. For example, the theory of balance, proposed by F. Harary and D. Cartwright, which considers the way triangles (relationships between 3 nodes) can be signed. This theory suggests that the most common types of triangles are three mutual friends (3 positive edges), or two friends with a common enemy (two negative and one positive edges).
Overall, this theory combined with the social nature of humans, which tend to form communities and connect (as opposed to Trolls who only want despair!), results in a trend to have higher frequencies of positive edges rather than negative edges in a given social network.
You can take our word for it! Or you should probably take a glance at the statistics recaps computed for each of the 3 datasets below :
| Epinions | Slashdot | Wikipedia | |
|---|---|---|---|
| Nodes | 131828 | 82140 | 7118 |
| Edges | 841372 | 549202 | 103747 |
| +edge | 85.3 | 77.4 | 78.8 |
| -edge | 14.7 | 22.6 | 21.2 |
| Triads | 13317672 | 1508105 | 790532 |
+edge and -edge show the proportion of positive and negative edges within the network. As mentioned above, our networks are all made up majoritarily of +edges, with over 77% positive edges.
But now then, how connected is our network? If we are naïve, for starter, we can take a look at the average number of edges per node :
| Avg. per node | Epinions | Slashdot | Wikipedia |
|---|---|---|---|
| Avg. # of edges | 6.38 | 6.69 | 14.57 |
| Avg. # of +edge | 5.44 | 5.18 | 11.48 |
| Avg. # of -edge | 0.94 | 1.52 | 3.089 |
The Wikipedia dataset has more than twice as many average number of edges per node. This is due to the fact that edges can’t be formed at will, since they are the results of voting on someone nominated for an election. On the other hand, Epinions and Slashdot have similar average number of edges per node, given that any user can form an edge towards any other user, though Epinions has a bigger share of positive links than Slashdot.
But averages don’t tell us much about the actual structure of the networks. For example, everyone may have on average 6 to more connections, with a very few subset that are sparsely connected (think of a normal distribution with minimal standard deviation!). Or, on the other hand, there may be a subset of users with an overwhelmingly large amount of connections (surely, these must be very popular), with another subset of users who have close to no edges such as casual users.
With a slightly less naïve approach, we look for the node degree distributions for each network. The node degree is simply the number of edges of a node, or more simply the number of connections a given node has. We decided to also show, on the left, what it looks like if we take the sign of edges as a parameter.
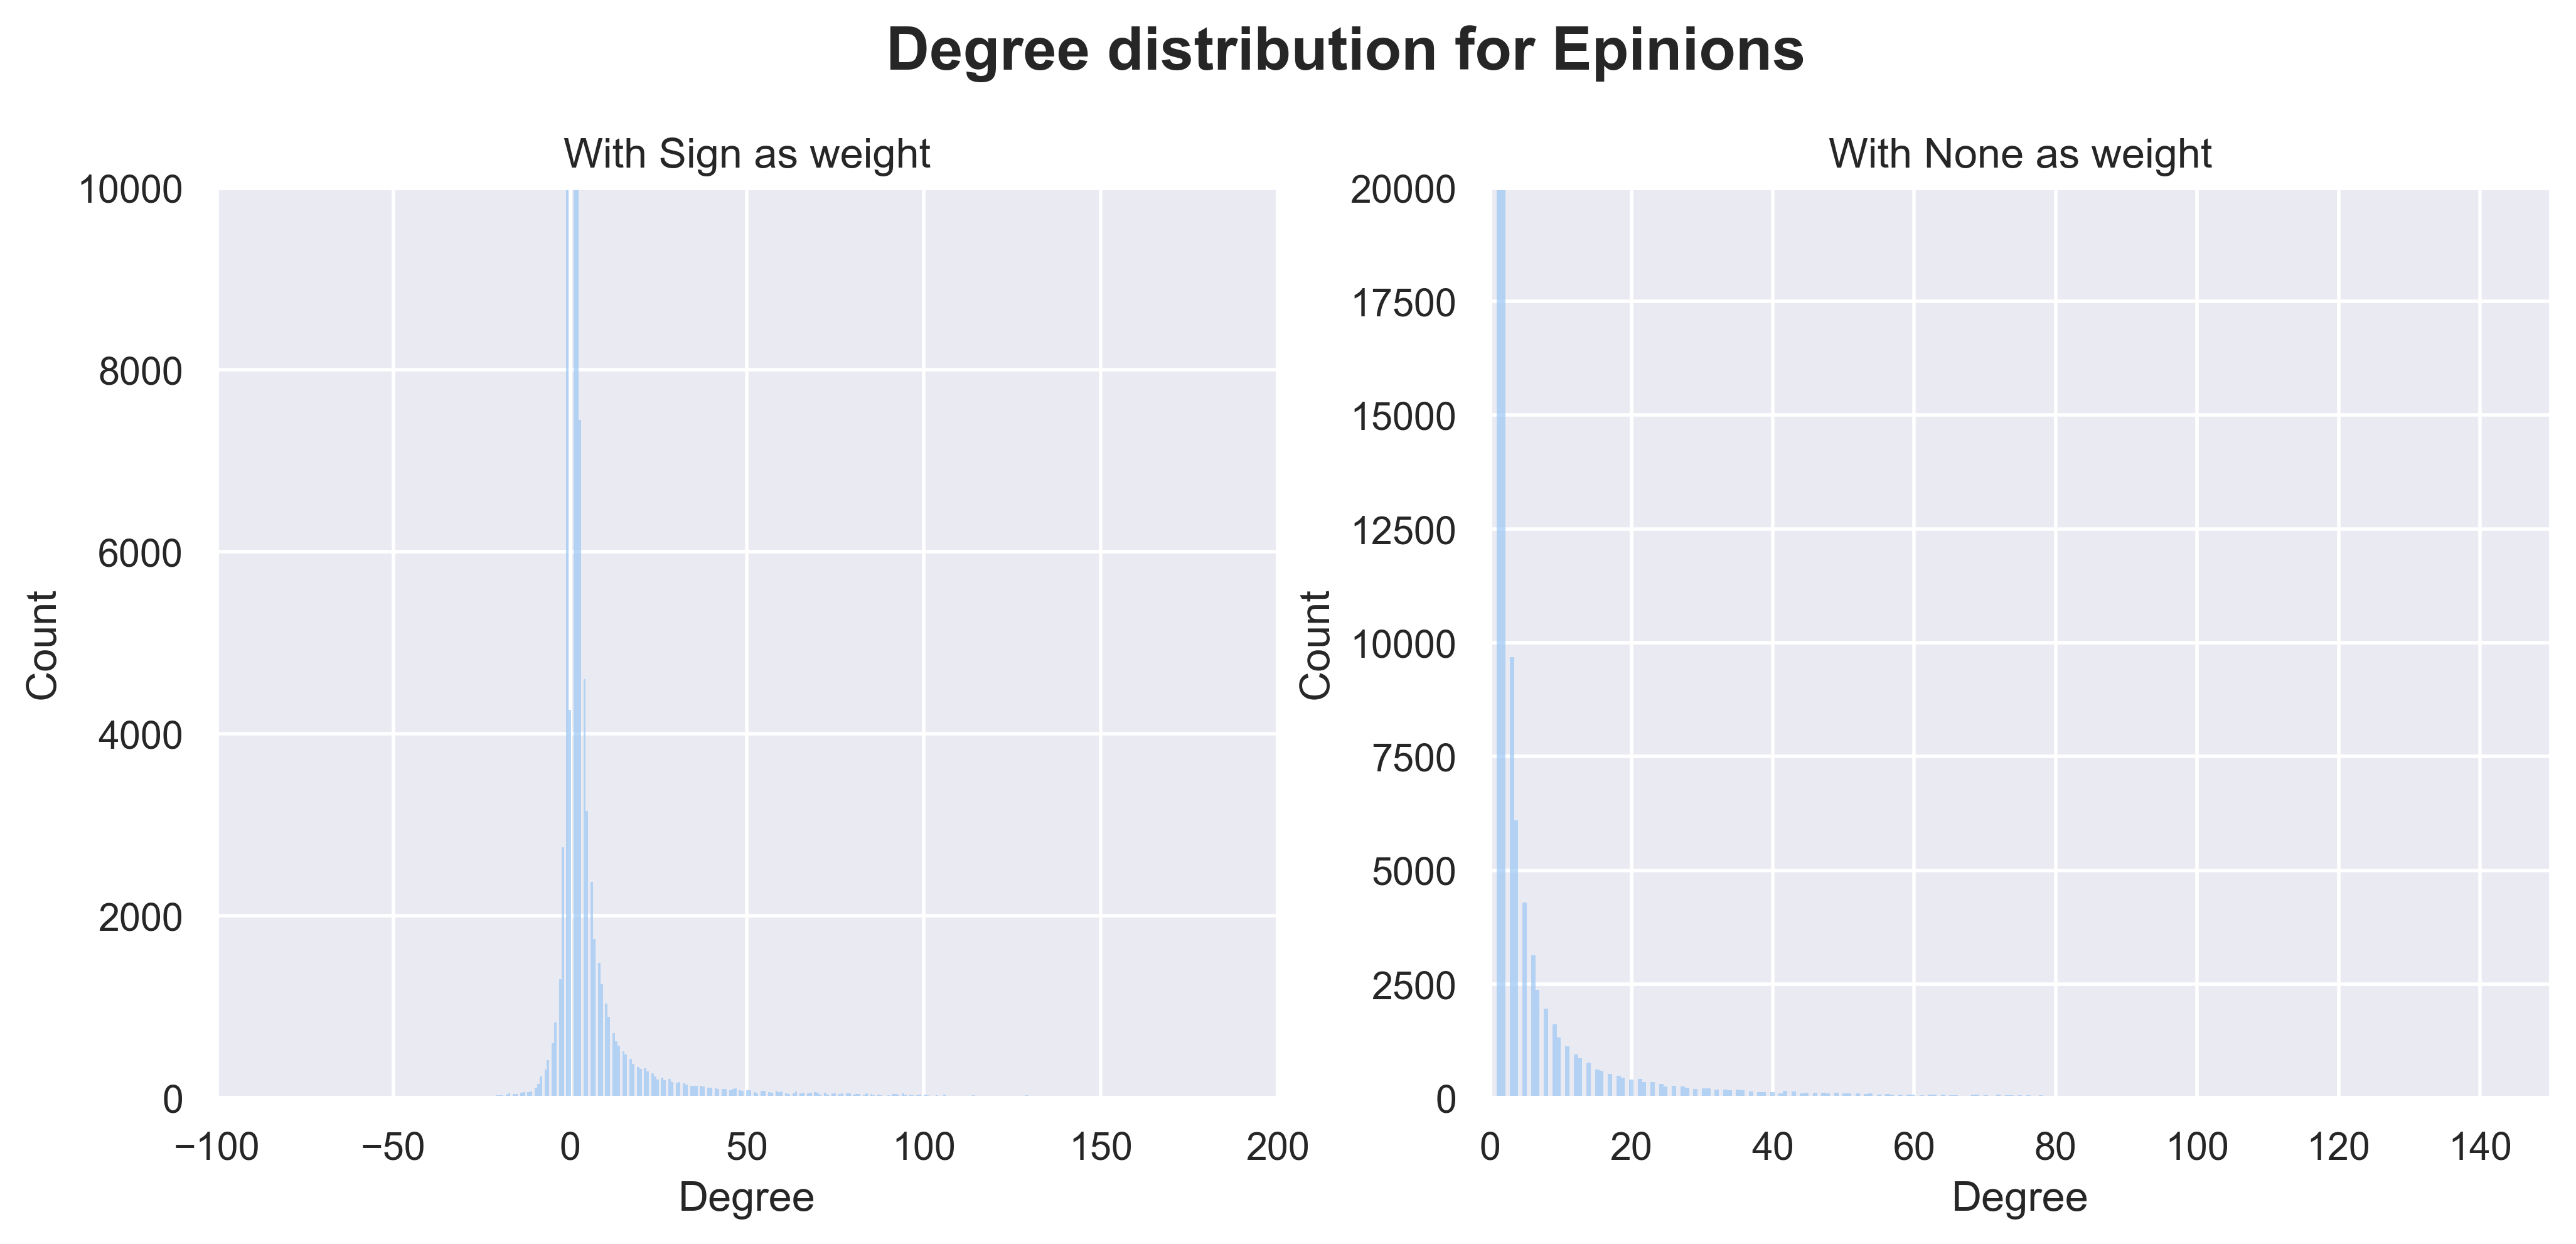
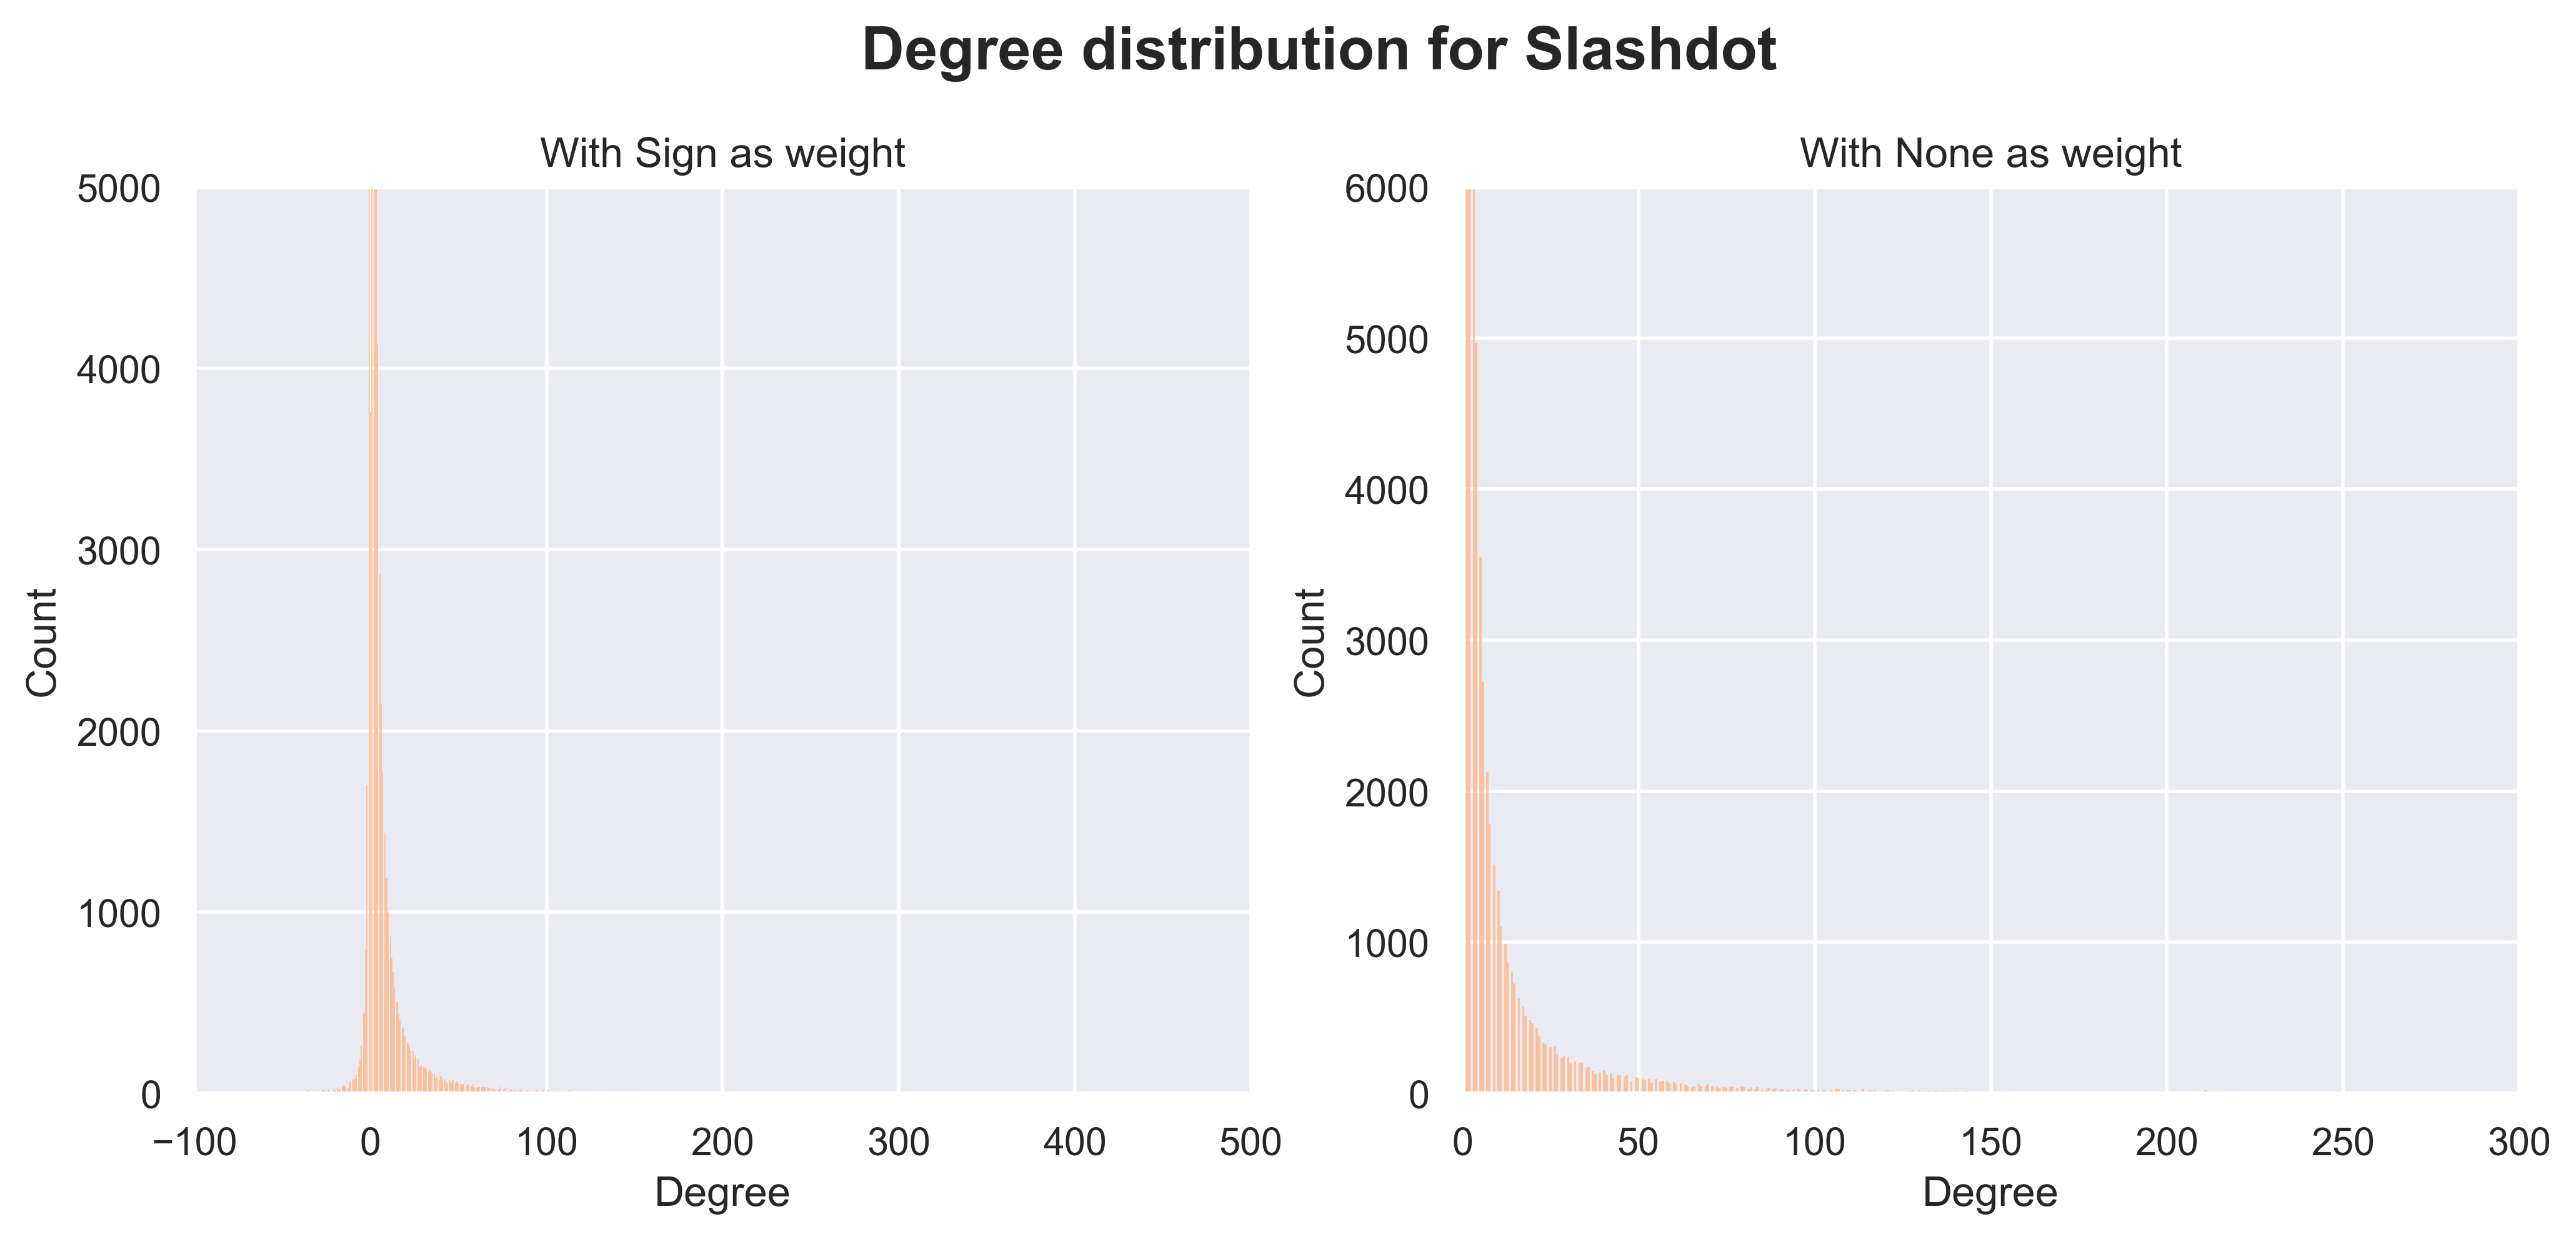
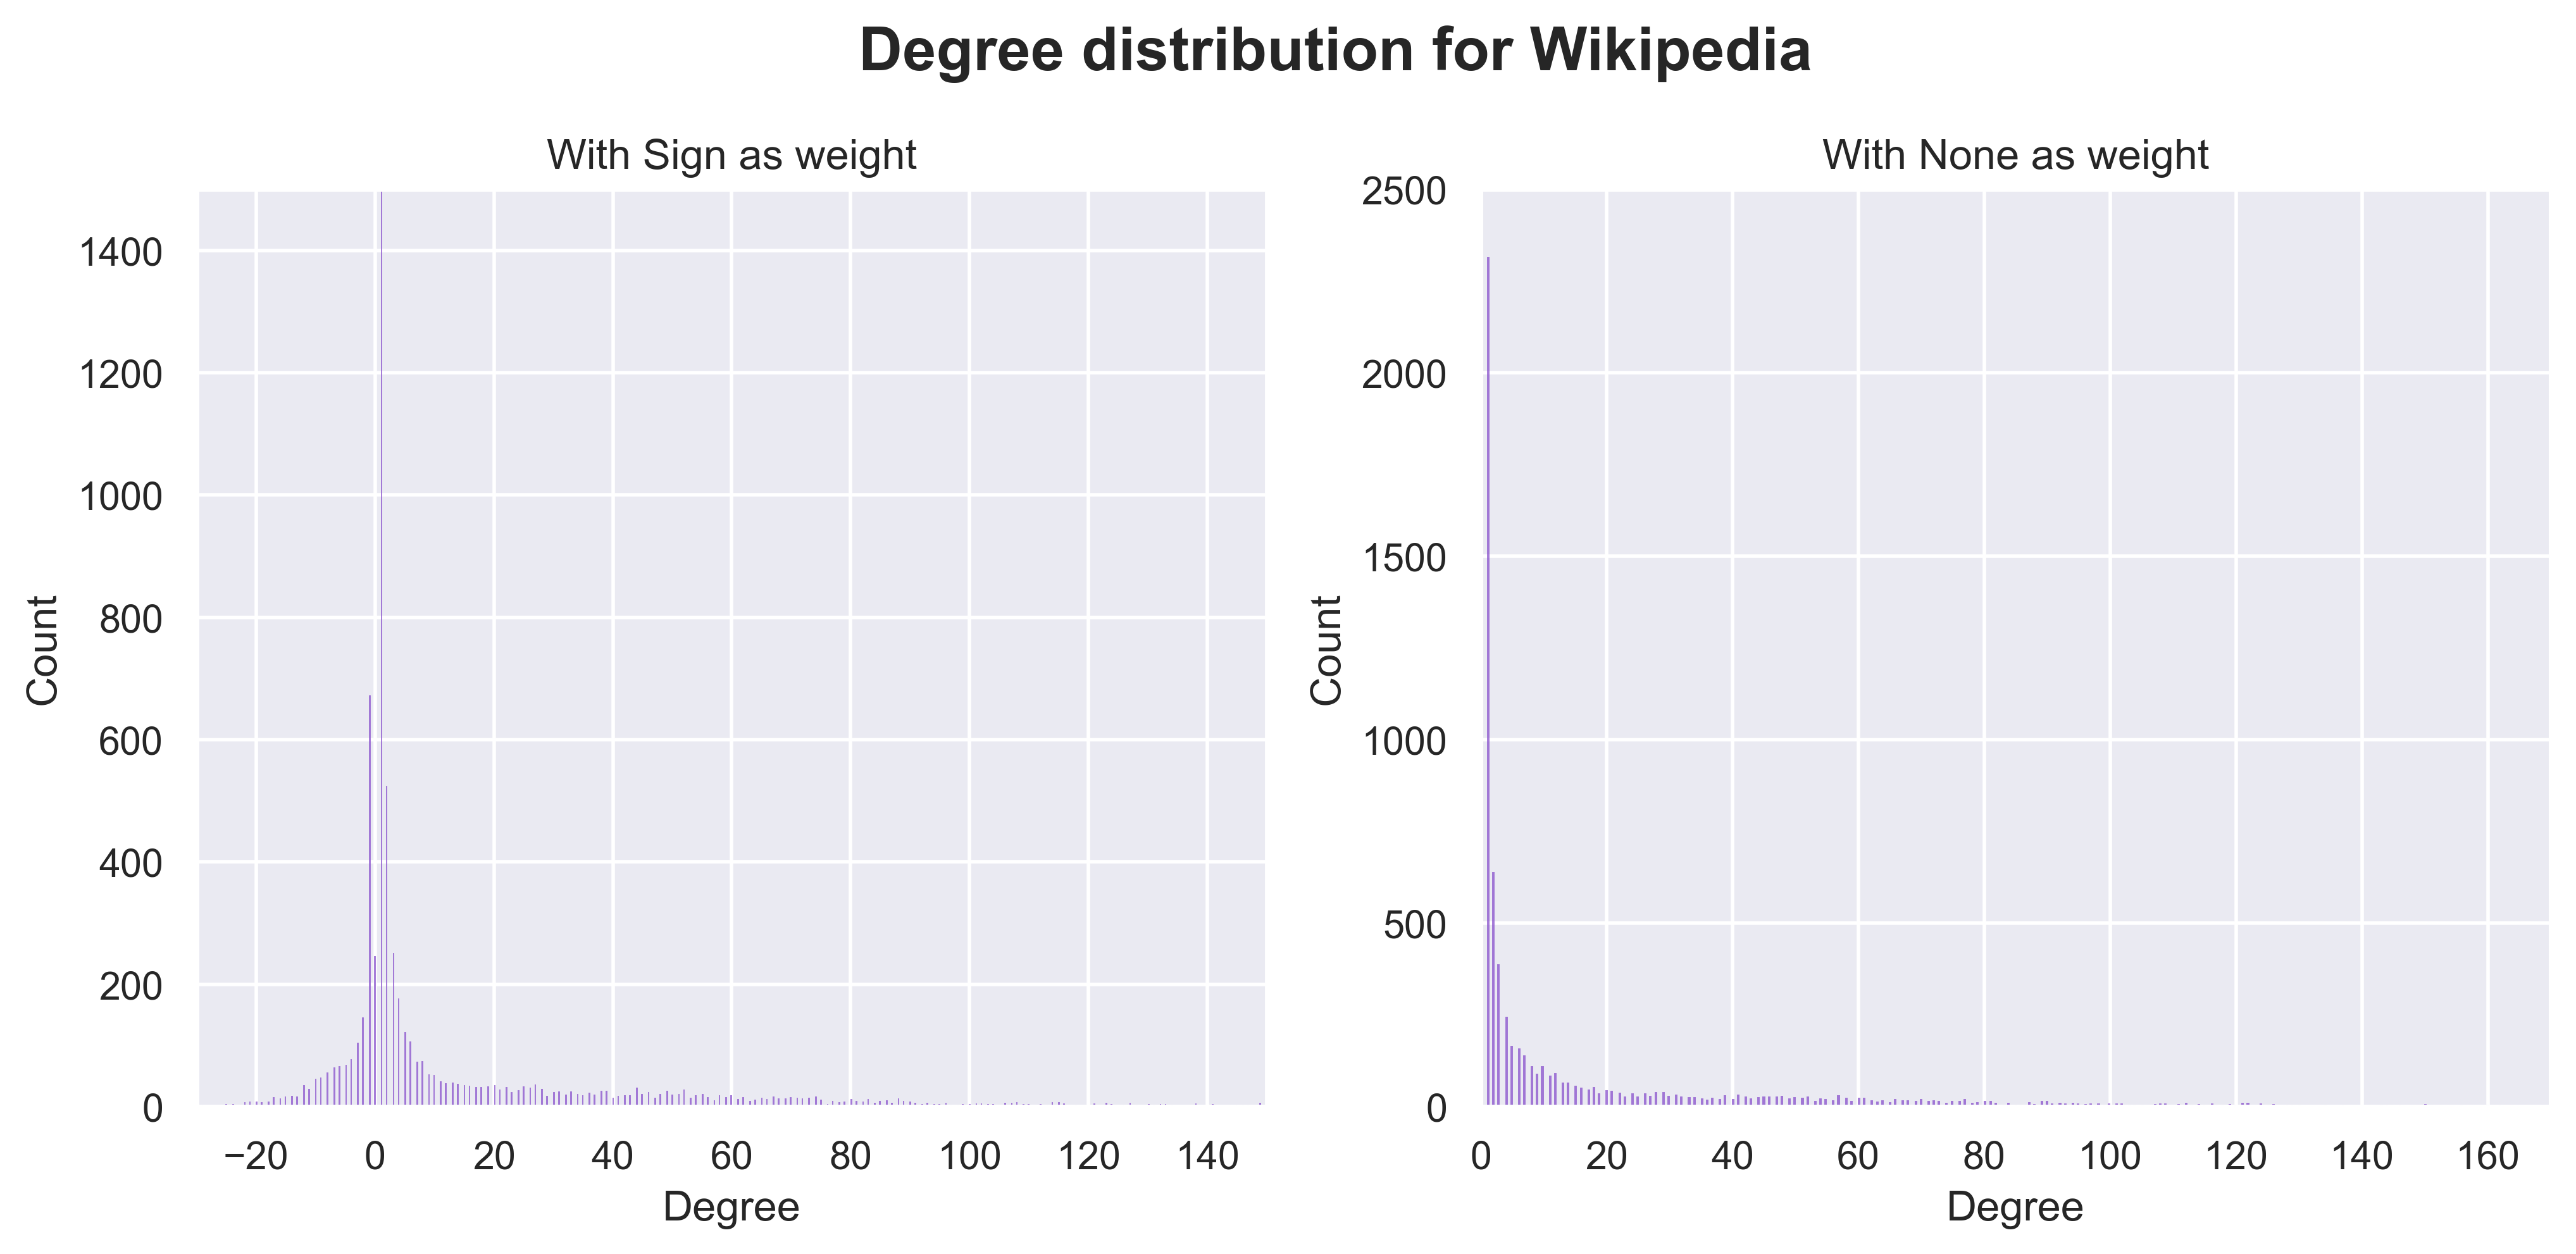
Without counting the sign, we see that the degree distribution follow a power law. It becomes evident that most users have very few connections, suggesting the networks may be sparsely connected. We verify this by looking at the checking the density of the network which are all below 5e-3. By taking the sign into account for calculating the degree, we see that the distribution is mostly skewed towards the right, showcasing once again the major proportion of positive edges. Interestingly, for Wikipedia’s signed degree distribution, we see to some extent two peaks around 0. Those may come from a seemingly large subset of users who voted only once or twice positively, or once or twice negatively and did not take part in any other votes.
| Epinions | Slashdot | Wikipedia | |
|---|---|---|---|
| Density | 4.86 e-5 | 8.14 e-5 | 2.05e-3 |
| Max Deg (Signed) | 3142 | 2495 | 695 |
| Max Deg. (Not) | 3622 | 2557 | 1167 |
Homophily, … flock together!
Given the size of Epinions and the nature of the Wikipedia dataset, we decided to focus on Slashdot for this part.
Now, what is this about Birds of a feather that flock together ? In network science homophily is the behaviour of associating (i.e. connecting) with people that are similar. This similarity can come from demographics, interests, etc. Such a group may have overall similar behaviour when creating edges, for example.
We first take nodes that have reciprocated edges with the same sign between them, and separate the network in positive and negative reciprocated sub-networks. By viewing reciprocated edges, effectively view the networks in an undirected view rather than directed. Coincidentally, this view aligns better with the social theory of structural balance as outlined by the authors of the paper ‘Signed networks in social media’.
source:Taken from Ciotti, Valerio. Positive and negative connections and homophily in complex networks. Diss. Queen Mary University of London, 2018.
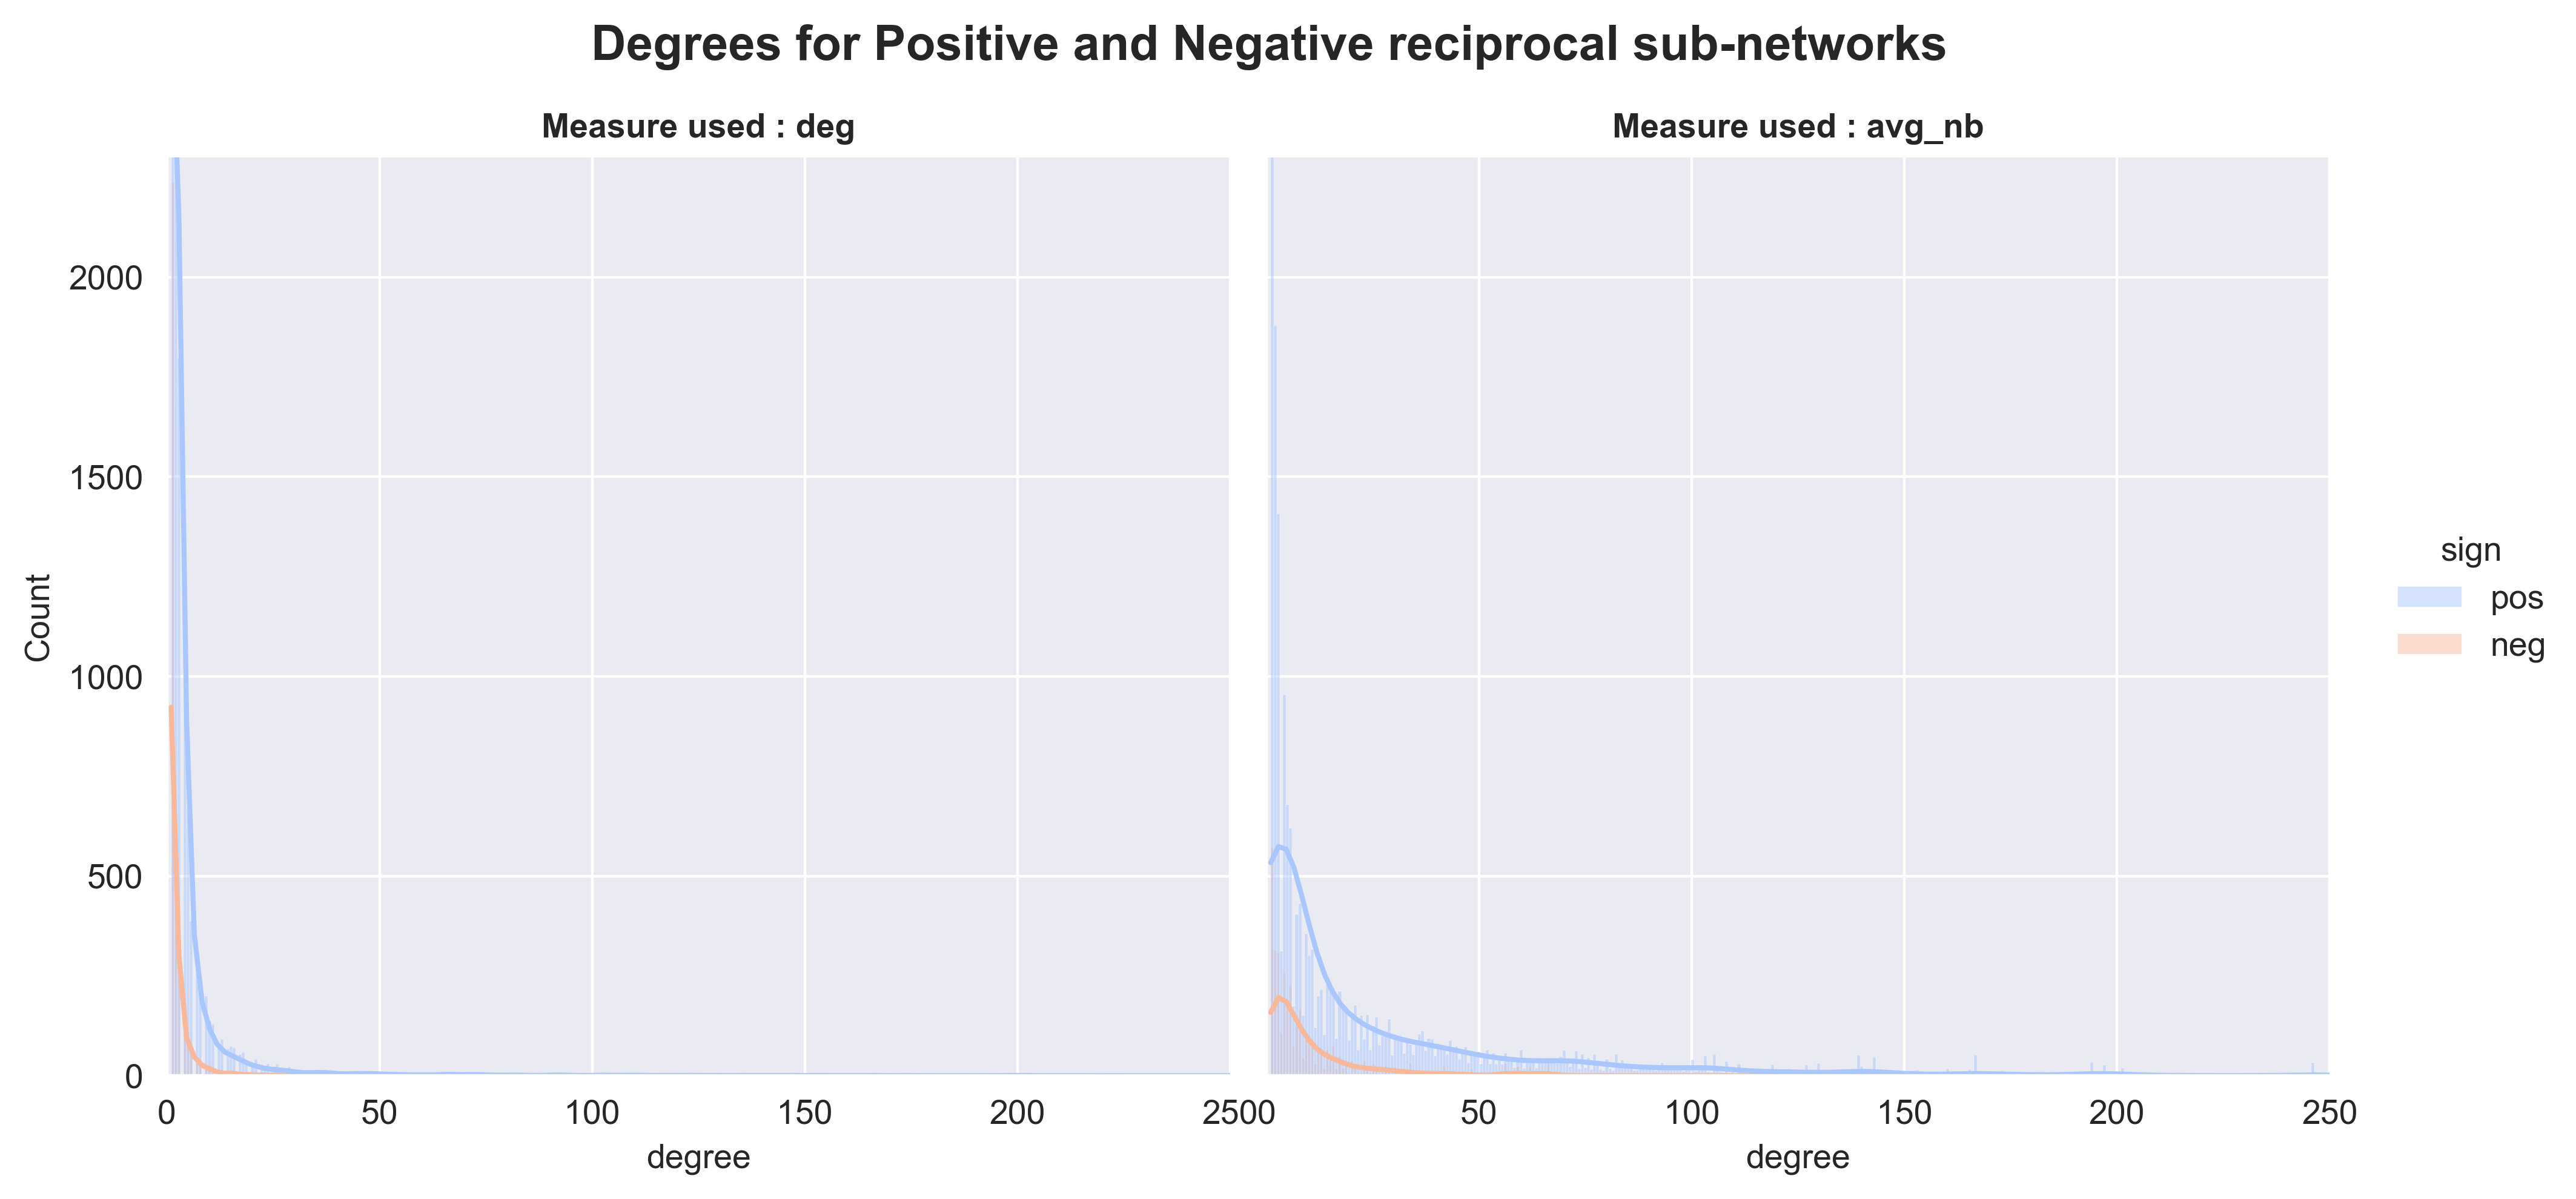
Reflecting real life behaviour, positive (i.e. friendly) people may have overall more connections, and be densely connected between them, whereas negative people (i.e. with more negative edges) will tend to be separated from these densely packed clusters, and overall less connected. Let’s take a peak at the degree and neighbour degree for both the positive and negative reciprocated sub-network :
| Positive | Negative | |
|---|---|---|
| Nodes | 20933 | 3682 |
| Largest c.c. | 15947 | 3016 |
| Max Deg. | 362 | 66 |
| Max Avg. Nbh. Deg. | 362 | 66 |
As metric, we took once again the degree, adding also the average neighbor degree for each sub networks. The average neighbor degree returns the average degree of the neighborhood of each node. It appears that both the degree and average neighbour degree are shifted to the right and overall higher. But given the stark difference between the number of nodes in each subgraph, it might be better to look at densities instead to confirm this :
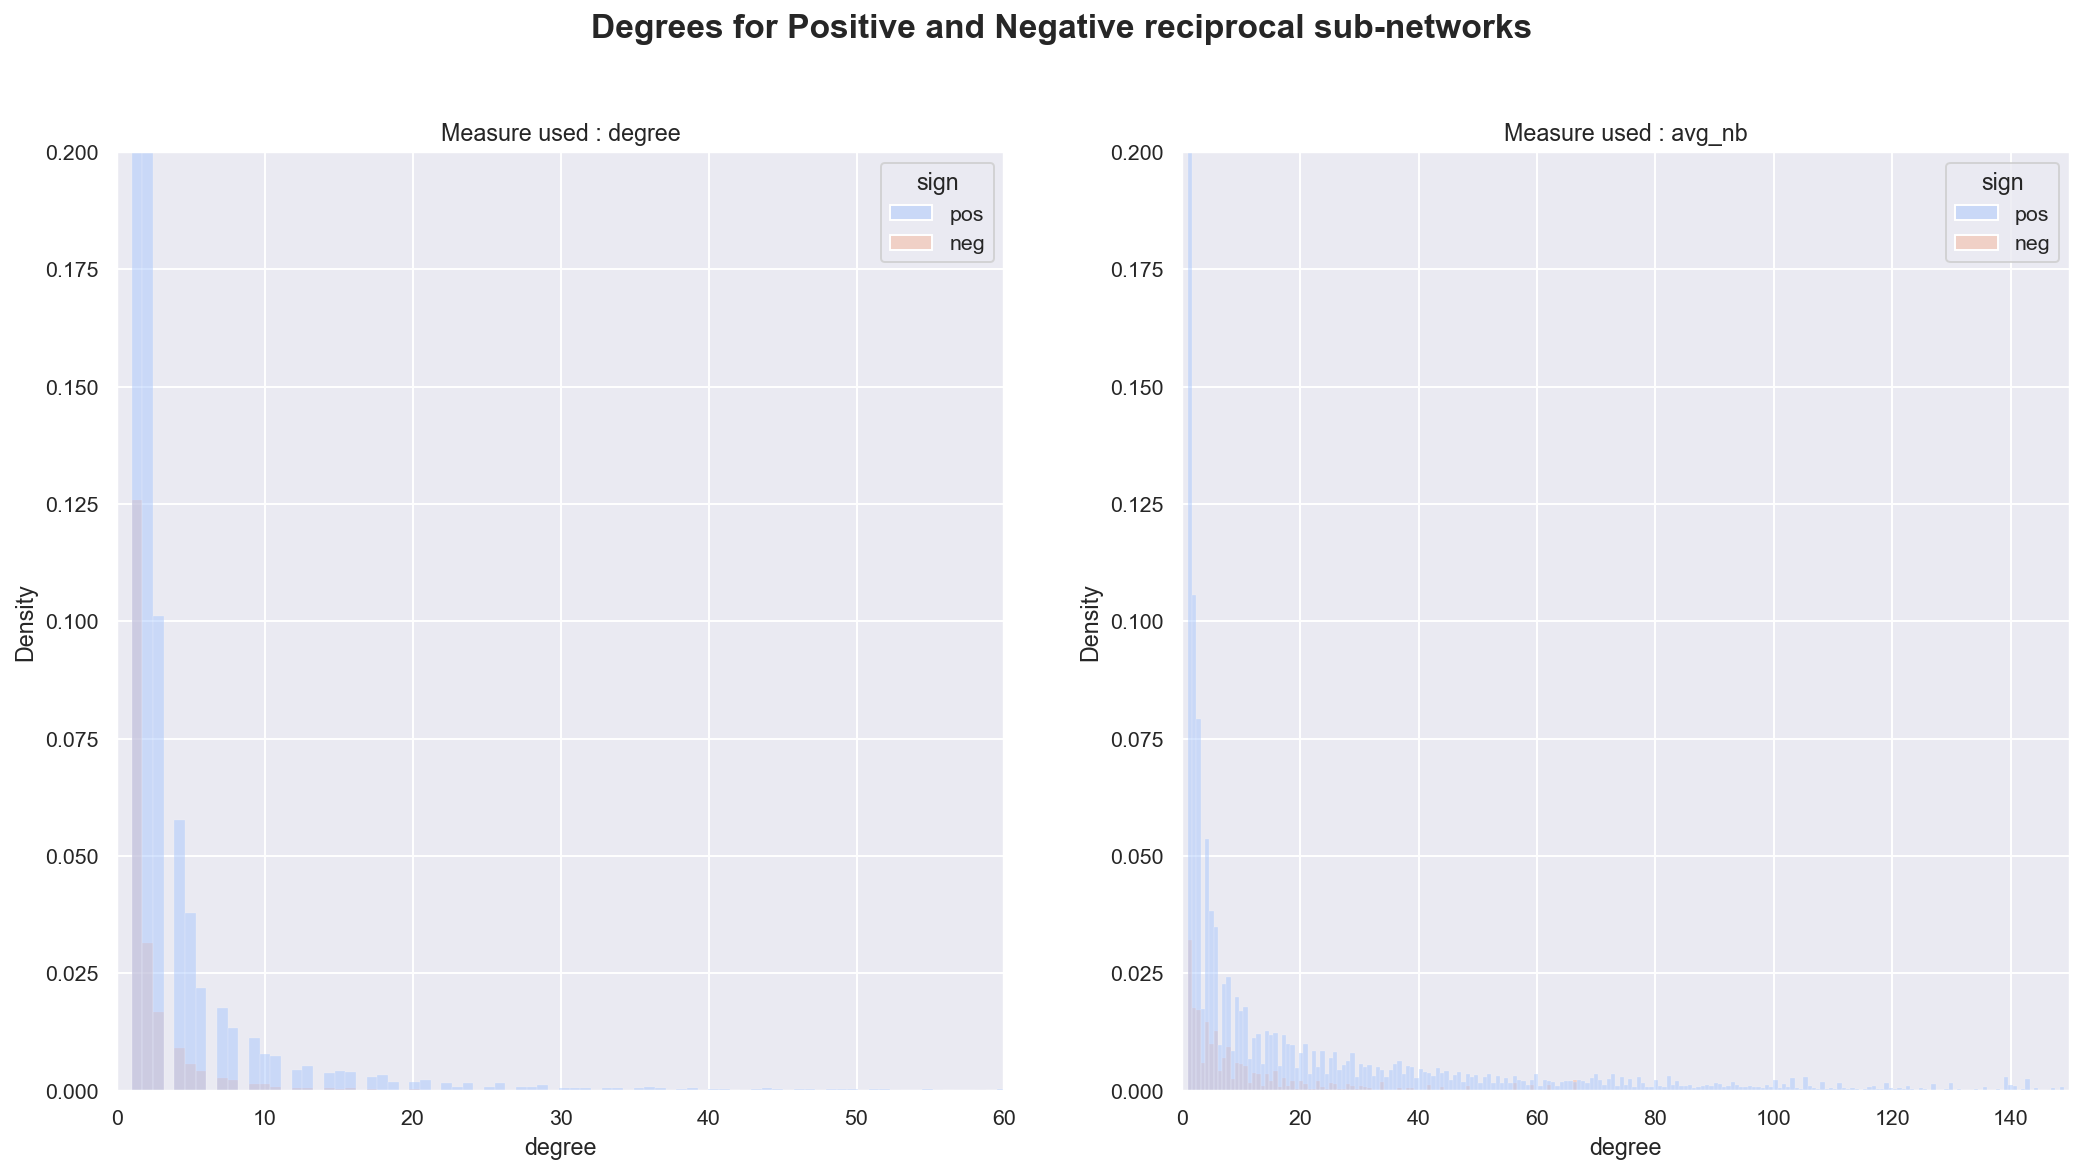
Comparing the densities reveal that the distribution of the positive subset has a much heavier right-tail than the one for the negative subset. Effectively, this means that the positive sub-set is more densely connected, and also connected to other nodes that have larger degree. This also means that the popular kids at school, tend to have have more friends who are also popular and are more likely to connect to other people that also have more friends !
We can check another metric using the average degree of the nearest neighbour :
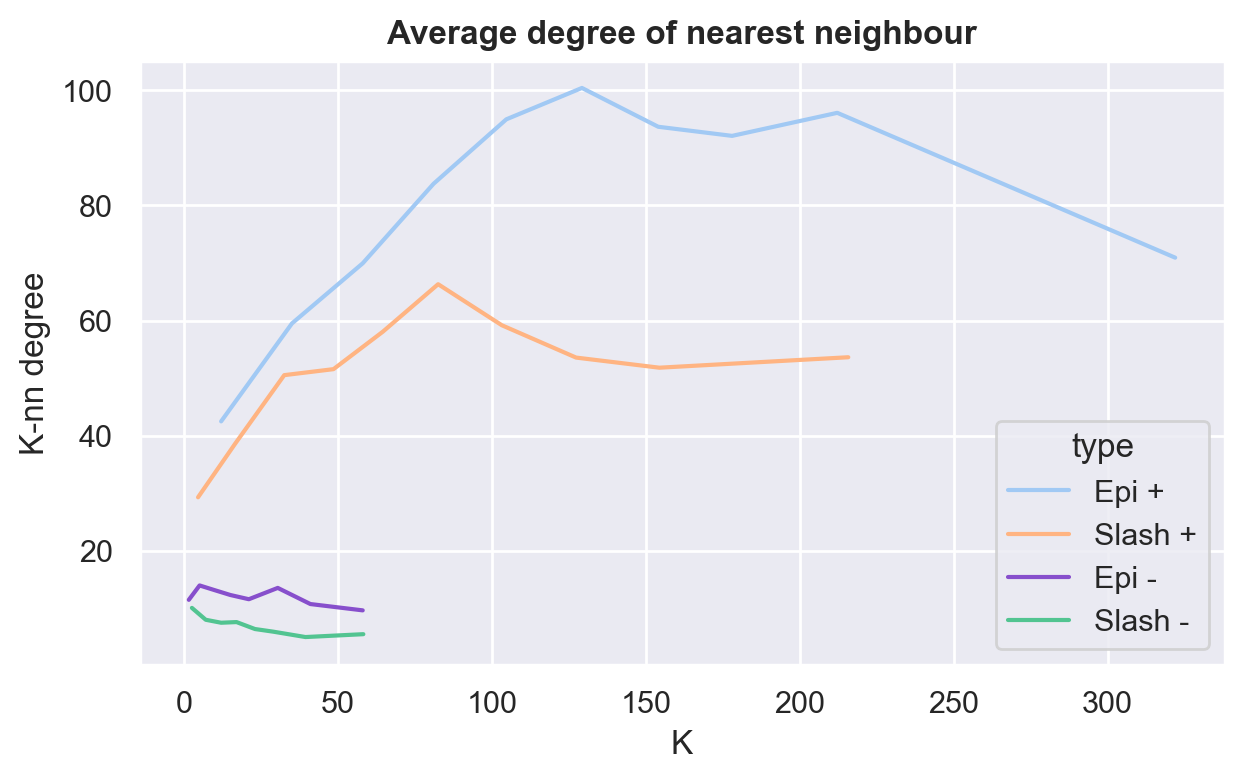
This graph shows the concept of assortativity which is the preference for a node to be linked to another node that has similar behavior. Here, the measure of similarity that we use is the degree of connections of a node. We observe that for the positive subnetwork, the degree correlation between nodes increases, meaning that nodes which connects with a lot of others nodes are connected with nodes that do the same, behave similarly. Thus, the positive network is assortative by degree. On the other hand, for the negative subnetwork, we observe that knn does not increase meaning that there is no degree correlation between these nodes. They don’t behave similarly.
| Assortativity | Positive | Negative |
|---|---|---|
| Slashdot | 0.2168 | -0.0224 |
| Epinions | 0.1619 | -0.1137 |
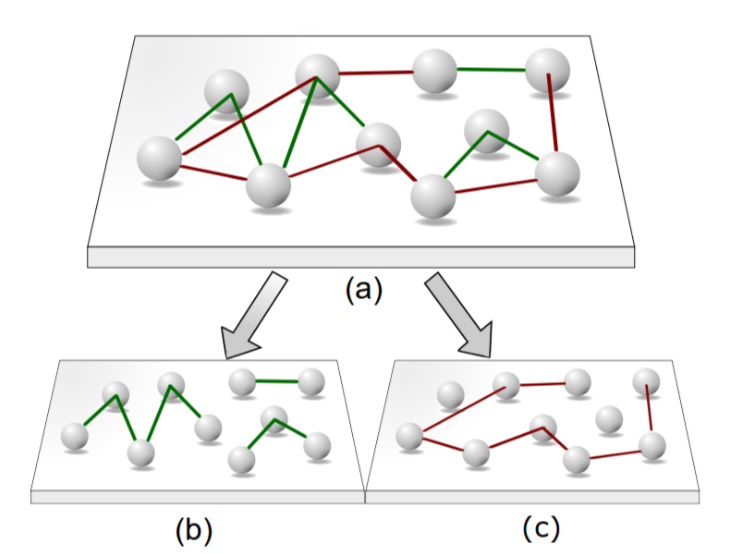
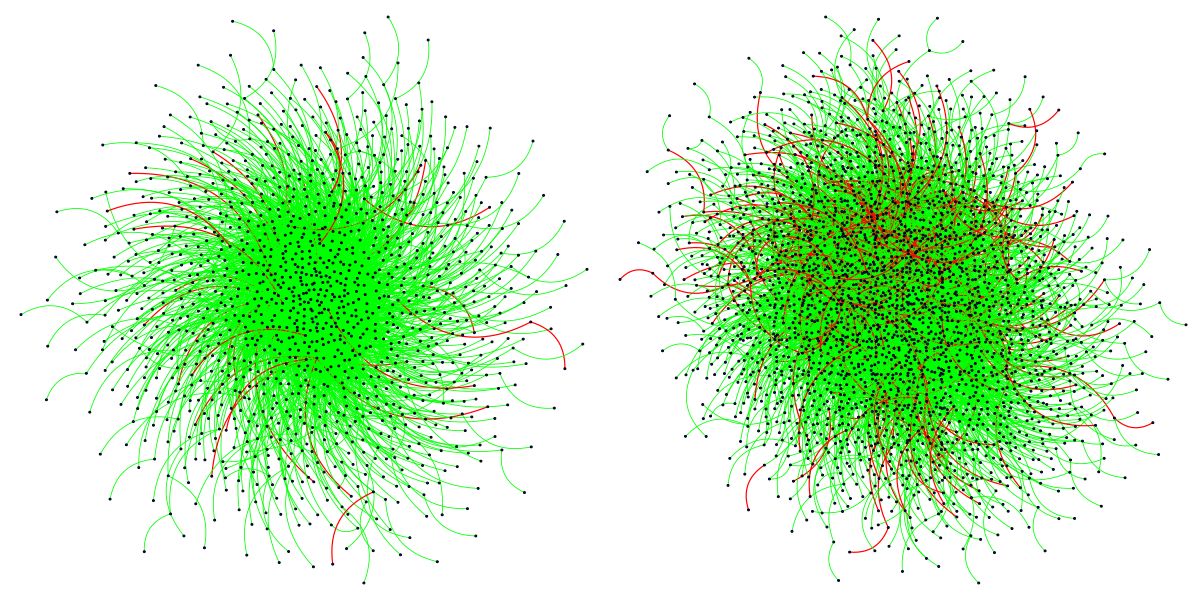
In the following graph, we took the largest connected component of the total reciprocal network. Then we chose nodes that have degrees in the top-95 percentile. We marked in green the positive edges and in red the negative edges.
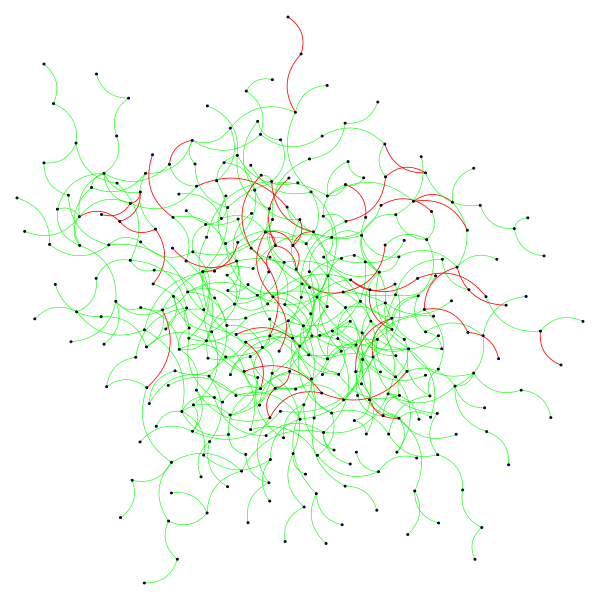
Visually, we notice that there are many more green edges than red edges, as explained above due to the difference in degree of nodes for both sub-networks. On top of that, we see that the positive subset is more densely connected than the negative subset.
Now, we want verify all this by clustering the undirected graph into communities using Leiden clustering, which is an improved version of Louvain clustering which optimises modularity. From keep the largest communities with over 1000 nodes. Within thoseand check if they follow the rules previously describe : i.e., we have many dense positive edges, with small amounts of negative edges.
As said previously, those clusters contains nodes that are densely connected with many positive edges, while negative edge are sparser, and mostly on the outside.
In conclusion, it would appear that birds of a green feather flock together, when birds with sad, red feathers get separated from the pack !
References
Related paper :
- J. Leskovec, D. Huttenlocher, and J. Kleinberg, ‘Signed networks in social media’, in Proceedings of the 28th international conference on Human factors in computing systems
- Ciotti, Valerio. Positive and negative connections and homophily in complex networks. Diss. Queen Mary University of London, 2018.
- Traag, V.A., Waltman, L. & van Eck, N.J. From Louvain to Leiden: guaranteeing well-connected communities. Sci Rep 9, 5233 (2019).